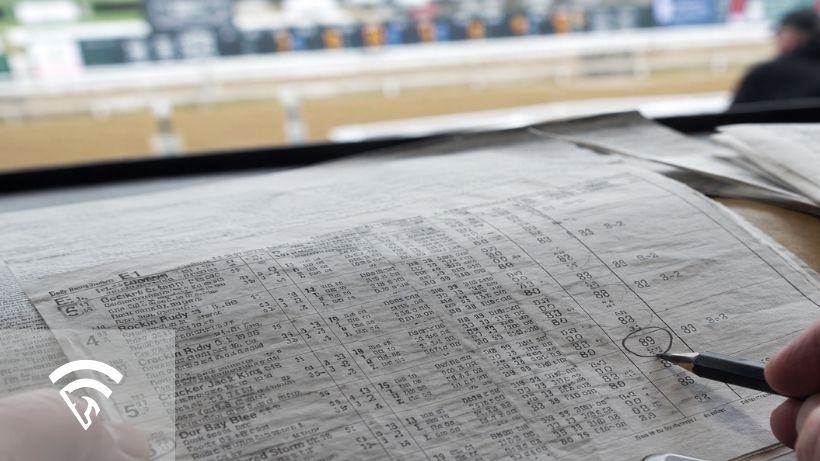
Key points
- A Brisnet Speed Figure rates a horse's performance on a normalized numerical scale, where higher numbers reflect faster race performances.
- Computer algorithms calculate these figures by comparing final race times against daily track variants that account for surface speed changes.
- The conversion scale assigns 1.5 points per beaten length in sprint races and 1 point per beaten length in route races.
- Benchmark figures range from 100 or higher for Grade 1 stakes runners down to 60 or lower for cheap maiden claiming races.
- Automated data processing produces Brisnet figures, eliminating human subjectivity across tracks in North America.
What is a Brisnet Speed Figure?
A Brisnet Speed Figure is a single numerical rating that measures how fast a horse ran in a race relative to track conditions and distance. Brisnet publishes these ratings in its Ultimate Past Performances to help handicappers compare performances across different tracks, surfaces, and dates.
Standard race times fail to tell the whole story. A horse running six furlongs in 1:10.0 on a dry, fast track might execute a weaker performance than a horse running six furlongs in 1:11.2 on a deep, sandy surface. Brisnet Speed Figures solve this issue by converting raw finishing times into standardized ratings. Higher numbers mean faster performances.
Handicappers rely on these numbers as core building blocks when evaluating form. Understanding standard speed figures allows bettors to spot hidden contenders, discard overbet favorites, and establish baseline class expectations for every entrant in a race.
How Brisnet Speed Figures are calculated
Brisnet calculates its speed ratings through an automated computer model. The algorithm processes raw finishing times, distance parameters, and surface conditions to yield a final single-number score.
The calculation process follows four core steps:
- Raw time evaluation: The system records the final time of the race winner or individual horse down to hundredths of a second.
- Base track speed comparison: The computer compares the finishing time against a historical baseline time for that specific distance and track layout.
- Track variant adjustment: The algorithm evaluates every race on the card to measure whether the main track or turf course played fast, slow, or neutral on that date.
- Distance and length adjustment: The model applies precise point-per-length deduction formulas based on whether the event was a sprint or a route.
Track variant adjustments
Track surfaces change speed throughout a single race card. Rain, temperature, maintenance crew harrowing, and daily soil moisture alter how fast a track plays.
Brisnet's automated system creates a daily track variant to account for these changes. If horses post fast times across every race on a Tuesday afternoon at Gulfstream Park, the system assigns a higher daily track variant. The algorithm deducts points from those raw times so the final speed figures reflect true equine ability rather than a artificially fast racing strip.
Sprint vs route length conversions
A margin of one beaten length equals different time values depending on race distance. Horses run at maximum velocity during short races, covering a length faster in sprints than during longer two-turn events.
To maintain precision, Brisnet uses two separate length-to-point conversion ratios:
- Sprint races (under 1 mile): 1 beaten length equals 1.5 speed figure points.
- Route races (1 mile and longer): 1 beaten length equals 1.0 speed figure point.
For example, if a winner earns a 90 Brisnet Speed Figure in a six-furlong sprint, a horse finishing 2 lengths behind receives a 87 rating (90 minus 3 points). If that same 2-length gap occurs in a 1 1/16-mile route, the runner receives an 88 rating (90 minus 2 points).
Benchmark Brisnet Speed Figures by class level
Knowing what a figure means requires understanding class benchmarks. A 90 speed figure represents an exceptional effort in claiming ranks, but that same 90 rating leaves a horse far behind in top-level stakes company.
The benchmark ranges below show typical winning Brisnet Speed Figures across North American racing classes:
- Grade 1 stakes: 100 to 115+
- Grade 2 and Grade 3 stakes: 96 to 105
- Listed and ungraded stakes: 92 to 100
- Allowance / Optional claiming: 86 to 95
- Open claiming ($25,000 to $50,000): 80 to 88
- Low-level claiming ($5,000 to $16,000): 70 to 80
- Maiden special weight: 78 to 88
- Maiden claiming: 55 to 72
Top horses competing in races like the Breeders' Cup Classic or Metropolitan Mile can earn Brisnet Speed Figures exceeding 115. Younger horses in maiden races usually start in the 60s or 70s before developing higher speed output with experience.
Brisnet Speed Figures vs Beyer Speed Figures
Handicappers frequently ask how Brisnet numbers differ from published Beyer Speed Figures found in the Daily Racing Form. While both systems rate final race times on a numerical scale, their underlying methodologies create distinct differences.
Calculation method: Computer vs human review
Brisnet relies entirely on computer modeling and statistical algorithms to analyze race cards and output daily track variants. This automated approach eliminates human bias and guarantees consistent calculation standards across minor tracks and major venues alike.
Beyer Speed Figures utilize a team of human handicappers led by Andrew Beyer. These experts manually review race times, analyze split times, identify unusual track bias patterns, and adjust final figures when computer models struggle with shifting weather or track maintenance.
Scale calibration differences
Brisnet Speed Figures generally run higher than Beyer Speed Figures for the exact same race performance. The typical offset ranges from 3 to 7 points higher on the Brisnet scale.
For instance, a winning effort in an allowance race might receive an 88 Beyer Speed Figure but earn a 93 Brisnet Speed Figure. The numerical difference reflects calibration scales rather than a discrepancy in performance evaluation.
Comparative overview
- Brisnet Speed Figures: Generated by automated algorithms. Covers all North American tracks uniformly. Scale runs approximately 3 to 7 points higher than Beyer. Includes integrated pace ratings like E1, E2, and Late Pace.
- Beyer Speed Figures: Uses human oversight for variant adjustments. Standard reference metric in Daily Racing Form. Scale runs lower than Brisnet.
- Thoro-Graph Sheets: Incorporates ground loss and weight carried. Uses a reverse scale where lower numbers indicate faster times. You can learn more about how weight and ground loss alter raw times by studying Thoro-Graph Sheets in detailed form analyses.
How to use Brisnet Speed Figures in handicapping
Raw speed figures offer high value, but relying on them in isolation leads to overbet horses and poor wagering value. Successful bettors integrate Brisnet figures alongside broader form analysis.
Spotting improving form and pattern moves
Look at a horse's last three to five races to establish performance trends. A three-year-old moving from a 72 to an 80 and then an 86 shows clear physical progression. These ascending figure patterns often point to horses coming into peak condition, making them strong contenders even when stepping up in class.
Identifying bounce risks
A "bounce" occurs when a horse runs an exceptionally high speed figure that taxes its physical energy, resulting in a significantly regression in its next start.
If a runner averages an 82 Brisnet figure across six career starts, suddenly pops a 96 on a wet track, and returns three weeks later as an even-money favorite, that horse carries high bounce risk. Smart handicappers avoid short odds on horses coming off an unsustainable spike in speed ratings.
Pairing speed figures with pace ratings
Final speed figures show how fast a horse ran from gate to wire, but they do not disclose how the horse distributed its energy. A horse running a 90 figure while setting blistering early fractions completed a harder task than a closer sitting behind a slow pace and cruising home late.
Brisnet past performances supply E1 (first call) and E2 (second call) pace ratings alongside final speed figures. A thorough reading of a race requires evaluating a horse's individual Pace Figure metrics to determine whether the projected pace setup favors early speed or deep closers.
Contextualizing race shape
Speed figures vary based on how a race unfolds. When multiple front-runners force a contested lead, the early energy burn often slows final race times, resulting in modest overall speed figures despite an intense competition. Understanding the broader race shape helps you recognize when a low speed figure was caused by a pace duel rather than a lack of talent.
How to read Brisnet Speed Figures in past performances
In Brisnet Ultimate Past Performances, speed figures appear prominently in the running line for each past race.
When reviewing a running line from left to right, you will locate:
- Date and track condition: Shows the track code and surface status (such as ft for fast, sy for sloppy, or fm for firm turf).
- Race distance and fractional times: Lists split times recorded at the leader's calls.
- Pace figures (E1 / E2): Appears before the final speed rating, showing early speed velocity.
- Brisnet Speed Figure: Bold single or double digits in the center of the line (e.g., 92).
- Late Pace rating (LP): Indicates how fast the horse ran over the final fraction of the race.
By viewing the E1, E2, Speed Figure, and LP numbers together, you gain a complete picture of how the horse managed its energy output throughout the contest.
Frequently asked questions about Brisnet Speed Figures
Is a higher or lower Brisnet Speed Figure better?
Higher numbers are better. A horse earning a 98 Brisnet Speed Figure ran faster than a horse earning an 84 under equivalent track conditions.
What is a good Brisnet Speed Figure?
A good figure depends on the class level of the race. A figure of 80 is strong in low-level claiming ranks, while top Grade 1 stakes events require figures of 100 or higher to contend.
How much do track conditions change Brisnet Speed Figures?
Raw times vary significantly based on track conditions, but the final Brisnet Speed Figure remains standardized. The daily track variant adjusts for muddy, sloppy, or deep surfaces, allowing direct figure comparisons across different days and track conditions.
Can you compare turf speed figures directly to dirt speed figures?
You can compare them on the numerical scale, but horses often show distinct surface preferences. A horse running a 92 on turf may not achieve that same 92 when switched to a dirt track. Evaluate surface history alongside raw speed figures.